Showing posts with label NS ECO 11TH EM. Show all posts

Statistics for Economics Class 11 NCERT Solutions Chapter 8 Index Numbers


Statistics for Economics Class 11 NCERT Solutions Chapter 8 Index Numbers

Question 1.
An index number which accounts for the relative importance of the items is known as
(i) weighted index
(ii) simple aggregative index
(iii) simple average of relatives
Answer:
(i) An index number becomes a weighted index when the relative importance of items is taken care of weighted index is the weighted average of different goods.

Question 2.
In most of the weighted index numbers the weight pertains to
(i) base year
(ii) current year
(iii) both base and current year
Answer:
(i) In general, the base period weight is preferred in calculating the weighted index number but as per Laspeyre’s method it uses the base year quantity as weight, Paache uses current year quantities as weight and Fisher’s Index Method uses both base and current year quantities.

Question 3.
The impact of change in the price of a commodity with little weight in the index will be
(i) small
(ii) large
(iii) uncertain
Answer:
(i) An equal rise in the price of an item with little weight will have lower implications for the overall change in the price ;ndex than that of an Item with more weight.

Question 4.
A consumer price index measures changes in
(i) retail prices
(ii) wholesale prices
(iii) producers’prices
Answer:
(i) Consumer Price Index (CPI), also known as the cost of living index, measures the average change in retail prices which show the most accurate impact of price rise on the cost of living of common people.

Question 5.
The item having the highest weight in consumer price index for industrial workers is
(i) food
(ii) housing
(iii) clothing
Answer:
(i) As weight and Fisher’s index method uses both base and current year quantities.
Food is given around 57% weight in CPI for industrial workers as it constitutes the major proportion of their total consumption.

Question 6.
In general, inflation is calculated by using
(i) wholesale price index
(ii) consumer price index
(iii) producer’s price index
Answer:
(i) The WPI is widely used to measure the rate of inflation. The weekly inflation rate is given by
XtXt1Xt1×100
where X, and Xt-1 to the WPI for the (t)th and (t- 1)th weeks.

Question 7.
Why do we need an index number?
Answer:
Index number enables us to calculate a single measure of change of a large number of items. The index numbers are needed for the general and specific purpose they are

  • Measurement of Change in the Price Level or the Value of ‘ Money Index number measures the value of money during different periods of time as well as we can use it to know the Impact of the change in the value of money on different sections of society. It can be worked out to correct the inflationary and deflationary gaps in the system.
  • Information of Foreign Trade Index of export and import provides useful information regarding foreign trade which helps in formulating the policies of export and import.
  • Calculating Real Wages CPI are used in calculating the purchasing power of money and real wage as follows
    • Purchasing power of money = 1/Cost of living index
    • Real wage = (Money wage/Cost of living index) × 100
  • Measuring and Comparing Output Index of Industrial Production (IIP) gives us a quantitative figure about the change in production in the industrial sector and thus helps in comparing industrial output in different periods. Similarly, agricultural production index provides us an estimate of the production index provides us an estimate of the production in agricultural sector.
  • Policy Making of Government With the help of index numbers government determines the minatory and fiscal prey and take nassery steps to develop the country.
  • Indicating Stock Prices Sensex and NIFT are index numbers of share prices on BSE and NSE respectively. They serve as a useful guide for investors in the stock market. If the sensex and nifty are rising, investors have positive expectations about the future performance of the economy and it is an appropriate time for investment.

Question 8.
What are the desirable properties of the base period?
Answer:
Base period should have the following properties

  • The base year should be a normal period and periods in which extraordinary events have occurred should not be taken as base periods as they are not appropriate for general comparisons.
  • Extreme values should not be selected as base period.
  • The period should not be too far in the past as comparison with current period cannot be done with such base year as policies, economic and social conditions change with time.
  • Base period should be updated periodically.

Question 9.
Why is it essential to have different CPI for different categories of consumers?
Answer:
The Consumer Price Index (CPI) in India is calculated for different categories as under

  • CPI for industrial workers.
  • CPI for urban non-manual employees.
  • CPI for agricultural labourers.

The reason behind calculation of three different CPIs is that the consumption pattern of the three groups (i.e., industrial workers, urban non-manual workers and agricultural labourers) differs significantly from each other. Therefore, to assess the impact of the price change on the cost of living of the three groups, component items included in the index need to be given different weights for each of the group. This necessitates the calculation of different CPI for different categories of consumers.

Question 10.
What does a consumer price index for industrial workers measure?
Answer:
Consumer price index for industrial workers measures the average change in retail prices of a basket of commodities which an industrial worker generally consumes. Consumer price index for industrial workers is increasingly being considered the appropriate indicator of general inflation, which shows the most accurate impact of price rise on the cost of living of common people.

The items included in CPI (Consumer Price Index) for industrial workers are food, pan, supari, tobacco, fuel and lighting, housing, colthing, and miscellaneous expenses with food being accorded the highest weight. This implies that the food price changes have a significant impact on the CPI.

Question 11.
What is the difference between a price index and a quantity index?
Answer:
The difference between a price index and a quantity index is as follows

  • Price index numbers measure and allow for comparison of the prices of certain goods while quantity index number measure the changes in the physical volume of production, construction or employment.
  • Price index numbers are more widely used as compared to quantity index numbers.
  • Price index is known as unweighted index number while quantity index number is known was weighted index numbers.

Question 12.
Is the change in any price reflected in a price index number?
Answer:
No, the change in any price is not reflected in a price index number. Price index numbers measure and permit comparison of the prices of certain goods included in the basket being used to compare prices in the base period with prices in the current period. Moreover, an equal rise in the price of an item with large weight and that of an item with low weight will have different implications for the overall change in the price index.

Question 13.
Can the CPI number for urban non-manual emplyees represent the changes in the cost of living of the President of India?
Answer:
The CPI for the urban non-manual employees cannot represent the changes in the cost of living of the President of India. This is because the consumption basket of an average non-manual employee does not consist of the items that would be a part of the consumption basket of the President of India.
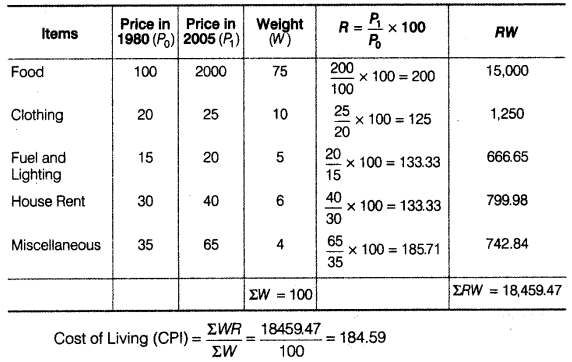
Question 14.
The monthly per capita expenditure incurred by workers for an industrial centre during 1980 and 2005 on the following items are given below. The weights of these items are 75, 10, 5, 6 and 4 respectively.
Prepare a weghted index number for cost of living for 2005 with 1980 as the base.
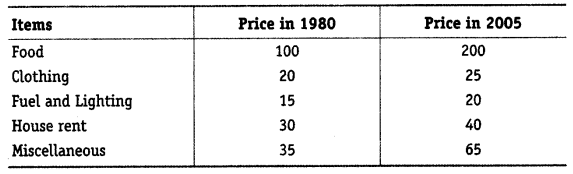
Statistics for Economics Class 11 NCERT Solutions Chapter 8 Index Numbers Q14
Answer:
Statistics for Economics Class 11 NCERT Solutions Chapter 8 Index Numbers Q14.1

Question 15.
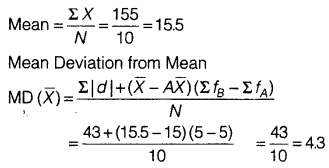
Read the following table carefully and give your comments.
Answer:
Index of Industrial Production Base 1993-94
Statistics for Economics Class 11 NCERT Solutions Chapter 8 Index Numbers Q15
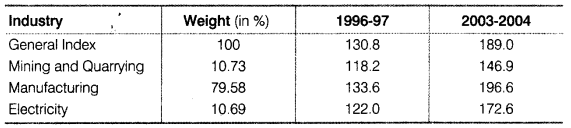
The following conclusions can be made by analysing the above table

  • Manufacturing industry has the highest weight of 79.58% in Index of Industrial Production (IIP) while mining and quarrying and electricity industries account for 10.73% and 10.69% respectively.
  • Manufacturing Industry has registered the highest growth among all industrial sectors in both the years 1996-97 and 2003-04.
  • Mining and quarrying has registered the lowest growth rate in both the years.
  • The General Index shows that industrial increased by 30.8% in 1996.-97 as compared to 1993-94 and by 89% in 2003-04.

Question 16.
Try to list the important items of consumption in your family.
Answer:
(This is a general example. You can use the actual consumption items in your family).
The following items constitute the total consumption needs for a family

  • Food
  • Clothing
  • House-Rent/EMI of Housing loan
  • Education
  • Electricity
  • Entertainment and recreation
  • Miscellaneous expenses

Question 17.
If the salary of a person in the base year is ? 4,000 per annum and the current year salary is ? 6,000 by how much should his salary rise to maintanin the same standard of living if the CPI is 400?
Answer:
Base CPI = ₹ 100
Current CPI = ₹400
Base Year Salary = ₹ 4,000
Current Year Salary = ₹ 6,000
When Base CPI is ₹100, then the salary is = ₹ 4,000
Current salary equivalent to base year salary = (Base year salary/100) × CPI of current year
When Current CPI is ₹ 400, then the salary should be
4,000100×400 = ₹ 16,000 100
Thus, his salary should be X 16,000 to maintain his purchasing power. Therefore, in the current year his salary should increase by ₹ 16,000 – ₹ 6,000 = ₹ 10,000 so as to maintain the same level of living in the current year as that of the base year.

Question 18.
The consumer price index for June, 2005 was 125. The food index was 120 and that of other items
What is the percentage of the total weight given to food?
Answer:
Statistics for Economics Class 11 NCERT Solutions Chapter 8 Index Numbers Q18
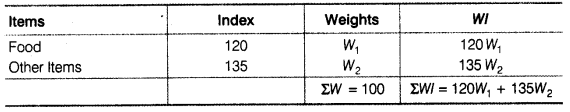
Let the total weight = 100
Wdenotes weight of food
W2 denotes weight of other items
So,
Statistics for Economics Class 11 NCERT Solutions Chapter 8 Index Numbers Q18.1
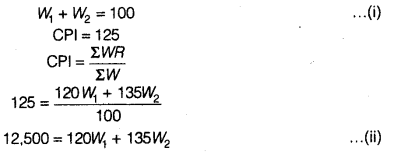
Multiplying both sides of Eq. (i) by 135 and subtracting Eq. (ii) from (i) we get
Statistics for Economics Class 11 NCERT Solutions Chapter 8 Index Numbers Q18.2
So, W1 = 100015 = 66.67
Substituting the value of in the Eq. (i), we get
W1 + W2 = 100
or 6667 + W2 = 100
W2 = 33.33
Therefore, percentage of total weight given to food is 66.67% and other items 33.33%.

Question 19.
An enquiry into the budgets of the middle class families in a certain city gave the following information
Statistics for Economics Class 11 NCERT Solutions Chapter 8 Index Numbers Q19
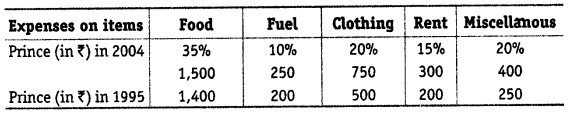
What is the cost of living index of 2004 as compared with 1995?
Answer:
Statistics for Economics Class 11 NCERT Solutions Chapter 8 Index Numbers Q19.1
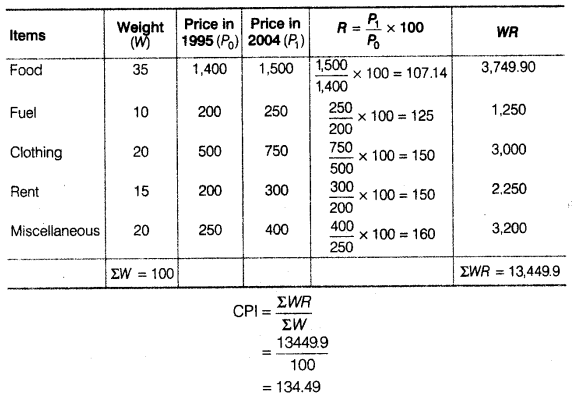
Cost of Living Index = 134.50
Thus, the price rose by 34.50% during 1995 and 2004.

Question 20.
Record the daily expenditure quantities bought and prices paid per unit of the daily purchases of your family for two weeks. How has the price change affected your family?
Answer:
This is a practical exercise. Record the daily expenditure, quantities bought and prices paid per unit of the daily purchases of your family for two weeks and try to analyse if quantities purchased decrease with rise in price of the respective items and also note if the percentage change in quantity brought about by a percentage change in price differ for different types of items.

Question 21.
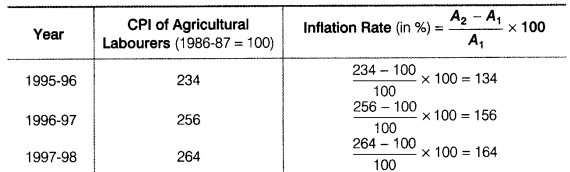
Given the following data
Statistics for Economics Class 11 NCERT Solutions Chapter 8 Index Numbers Q21
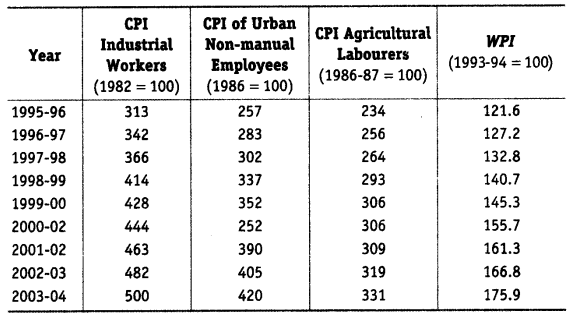
Source Economic Survey, Government of India 2004-2005
(i) Calculate the inflation rates using different index numbers.
(ii) Comment on the relative values of the index numbers.
(iii) Are they comparable?
Answer:
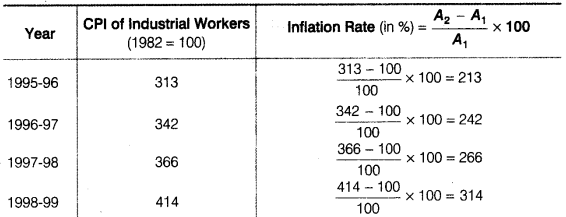
(i) (a) Inflation using CPI of Industrial Workers
Statistics for Economics Class 11 NCERT Solutions Chapter 8 Index Numbers Q21.1

Statistics for Economics Class 11 NCERT Solutions Chapter 8 Index Numbers Q21.2
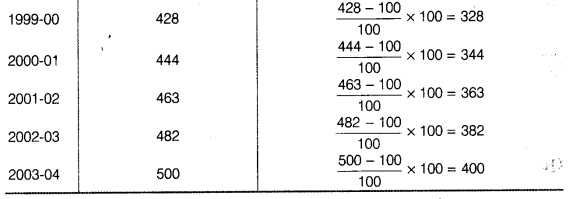
(b) Inflation using CPI of Non-maunal Employees
Statistics for Economics Class 11 NCERT Solutions Chapter 8 Index Numbers Q21.3
(c) Inflation using CPI of Agricultural Labourers
Statistics for Economics Class 11 NCERT Solutions Chapter 8 Index Numbers Q21.4

Statistics for Economics Class 11 NCERT Solutions Chapter 8 Index Numbers Q21.5
(d) Inflation using WPI
Statistics for Economics Class 11 NCERT Solutions Chapter 8 Index Numbers Q21.6
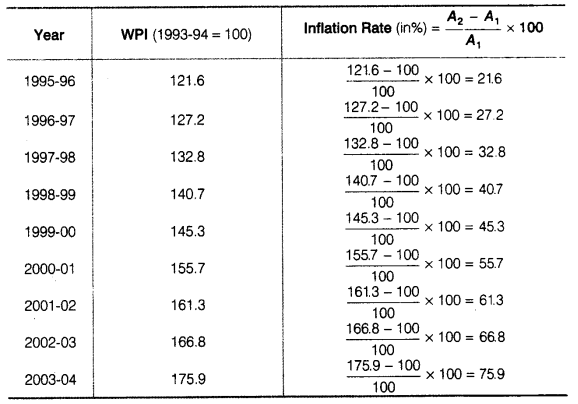
(ii) The inflation rate calculated using CPI industrial worker with the base year 1982 is the highest and inflation rate calculated using WPI with the base year 1993-94 is the least.
(iii) No the index number are not comparable because of the following reasons

  • Base periods for CPI of industrial workers, urban non-manual workers, agricultural labourers and WPI are different.
  • Commodities and their weightage in different index number may be different.

Statistics for Economics Class 11 NCERT Solutions Chapter 7 Correlation


Statistics for Economics Class 11 NCERT Solutions Chapter 7 Correlation

Question 1.
The unit of correlation coefficient between height in feet and weight in kgs is
(a) kg/feet
(b) percentage
(c) non-existent
Answer:
(c) Correlation coefficient (r) has no unit. It is a pure number. It meansss units of measurement are not part of r.

Question 2.
The range of simple correlation coefficient is
(a) 0 to infinity
(b) minus one to plus one
(c) minus infinity to infinity
Answer:
(b) The value of the correlation coefficient lies between minus one and plus one, -1 ≤ r ≤ 1. If the value of r is outside this range it indicates error in calculation.

Question 3.
If rXY is positive the relation between X and Y is of the type
(a) when Y increases X increases
(b) when Y decreases X increases
(c) when Y increases X does not change
Answer:
(a) If r is positive the two variables move in the same direction. e.g., when the price of coffee rises, the demand for tea also rises as coffee is a substitute of tea. Therefore, the r between price of coffee and demand for tea will be positive.

Question 4.
If rXY = 0, the variable X and Y are
(a) linearly related
(b) not linearly related
(c) independent
Answer:
(b) If rXY = 0, it means the two variables are uncorrelated and there is no linear relation between them. However, other types of relation may be there and they may not be independent.

Question 5.
Of the following three measures which can measure any type of relationship?
(a) Karl Pearson’s coefficient of correlation
(b) Spearman’s rank correlation
(c) Scatter diagram
Answer:
(c) The scatter diagram gives a visual presentation of the relationship and is not confined to linear relations. Karl Pearson’s coefficient of correlation and Spearman’s rank correlation are strictly the measures of linear relationship.

Question 6.
If precisely measured data are available the simple correlation coefficient is
(a) more accurate than rank correlation coefficient
(b) less accurate than rank correlation coefficient
(c) as accurate as the rank correlation coefficient
Answer:
(a) Rank correlation should be used only when the variables cannot be measured precisely, generally it is not as accurate as the simple correlation coefficient as all the information concerning the data is not utilised in this.

Question 7.
Why is r preferred to covariance as a measure of association?
Answer:
Both, correlation coefficient and covariance measure the degree of linear relationship between two variables, but correlation coefficient is generally preferred to covariance due to the following reasons

  • The correlation coefficient (r) has no unit.
  • The correlation coefficient is independent of origin as well as scale.

Question 8.
Can r lie outside the -1 and 1 range depending on the type of data?
Answer:
No the value of the correlation coefficient lies between minus one and plus one, -1 ≤ r ≤ 1. If the value of r is outside this range in any type of data, it indicates error in calculation.

Question 9.
Does correlation imply causation?
Answer:
No, correlation measures do not imply causation. Correlation measures co-variation and not causation.
Correlation does not imply cause and effect relation. The knowledge of correlation only gives us an idea of the direction and intensity of change in a variable when the correlated variable changes. The presence of correlation between two variables X and Y simply means that when the value of one variable is found to change in one direction, the value of the other variable is found to change either in the same direction (i.epositive change) or in the opposite direction (i.e., negative change), in a definite way.

Question 10.
When is rank correlation more precise than simple correlation coefficient?
Answer:
Rank correlation is more precise than simple correlation coefficient in the following situations

  • When the Measurements of the Variables are Suspect e.g., in a remote village where measuring rods or weighing scales are not available, height and weight of people cannot be measured precisely but the people can be easily ranked in terms of height and weight.
  • When Data is Qualitative It is difficult to quantify qualities such as fairness, honesty etc. Ranking may be a better alternative to quantification of qualities.
  • When Data has Extreme Values Sometimes the correlation coefficient between two variables with extreme values may be quite different from the coefficient without the extreme values. Under these circumstances rank correlation provides a better alternative to simple correlation.

Question 11.
Does zero correlation mean independence?
Answer:
No, zero correlation does not mean independence. If there is zero correlation (rXY = 0), it means the two variables are uncorrelated and there is no linear relation between them. However, other types of relation may be there and they may not be independent.

Question 12.
Can simple correlation coefficient measure any type of relationship?
Answer:
No, simple correlation coefficient can measure only linear relationship.

Question 13.
List some variables where accurate measurement is difficult.
Answer:
Accurate measurement is difficult in case of

  • Qualitative variables such as beauty, intelligence, honesty, etc.
  • It is also difficult to measure subjective variables such as poverty, development, etc which are interpreted differently by different people.

Question 14.
Interpret the values of r as 1, -1 and 0.
Answer:

  • If r = 0 the two variables are uncorrelated. There is no linear relation between them. However, other types of relation may be there and hence the variables may not be independent.
  •  If r= 1 the correlation is perfectly positive. The relation between them is exact in the sense that if one increases, the other also increases in the same proportion and if one decreases, the other also decreases in the same proportion.
  • If r = -1 the correlation is perfectly negative. The relation between them is exact in the sense that if one increases, the other decreases in the same proportion and if one decreases, the other increases in the same proportion.

Question 15.
Why does rank correlation coefficient differ from Pearsonian correlation coefficient?
Answer:
Rank correlation coefficient differs from Pearsonian correlation coefficient in the following ways

  • Rank correlation coefficient is generally lower or equal to Karl Pearson’s coefficient.
  • Rank correlation coefficient is preferred to measure the correlation between qualitative variables as these variables cannot be measured precisely.
  • The rank correlation coefficient uses ranks instead of the full set of observations that leads to some loss of information.
  • If extreme values are present in the data, then the rank correlation coefficient is more precise and reliable.

Question 16.
Calculate the correlation coefficient between the heights of fathers in inches (X) and their sons (Y).
Statistics for Economics Class 11 NCERT Solutions Chapter 7 Correlation Q16
Answer:
Statistics for Economics Class 11 NCERT Solutions Chapter 7 Correlation Q16.1
Note Answer: printed in NCERT is incorrect.

Question 17.
Calculate the correlation coefficient between X and Y and comment on their relationship.
Statistics for Economics Class 11 NCERT Solutions Chapter 7 Correlation Q17
Answer:
Statistics for Economics Class 11 NCERT Solutions Chapter 7 Correlation Q17.1

Statistics for Economics Class 11 NCERT Solutions Chapter 7 Correlation Q17.2
As the value of r is zero, so there is no linear correlation between X and Y.

Question 18.
Calculate the correlation coefficient between X and Y and comment on their relationship.
Statistics for Economics Class 11 NCERT Solutions Chapter 7 Correlation Q18
Solution
Statistics for Economics Class 11 NCERT Solutions Chapter 7 Correlation Q18.1
As the correlation coefficient between the two variables is + 1, so the two variables are perfectly positive correlated.

Statistics for Economics Class 11 NCERT Solutions Chapter 6 Measures of Dispersion


Statistics for Economics Class 11 NCERT Solutions Chapter 6 Measures of Dispersion

Question 1.
A measure of dispersion is a good supplement to the central value in understanding a frequency distribution. Comment.
Answer:
Dispersion is the extent to which values in a distribution differ from the avarage of the distribution. Knowledge of only average is insufficient as it does not reflect the quantum of variation in values.

Measures of dispersion enhance the understanding of a distribution considerably by providing information about how much the actual value of items in a series deviate from the central value, e.g., per capita income gives only the average income but a measure of dispersion can tell you about income inequalities, thereby improving the understanding of the relative living standards of different sections of the society. Through value of dispersion one can better understand the distribution.

Thus a measure of dispersion is a good supplement to the central value in understanding a frequency distribution.

Question 2.
Which measure of dispersion is the best and how?
Answer:
Standard Deviation is considered to be the best measure of dispersion and is therefore the most widely used measure of dispersion.

  • It is based on all values and thus provides information about the complete series. Because of this reason, a change in even one value affects the value of standard deviation.
  • It is independent of origin but not of scale.
  • It is us’eful in advanced statistical calculations like comparison of variability in two data sets.
  • It can be used in testing of hypothesis.
  • It is capable of further algebraic treatment.

Question 3.
Some measures of dispersion depend upon the spread of values whereas some calculate the variation of values from a central value. Do you agree?
Answer:
Yes, it is true that some measures of dispersion depend upon the spread of values, whereas some calculate the variation of values from the central value. Range and Quartile Deviation measure the dispersion by calculating the spread within which the value lie. Mean Deviation and Standard Deviation calculate the extent to which the values differ from the average or the central value.

Question 4.
In town, 25% of the persons earned more than ₹ 45,000 whereas 75% earned more than 18,000. Calculate the absolute and relative values of dispersion.
Answer:
25% of the persons earned more than ₹ 45,000. This implies that upper quartile Q3 = 45,000 75% earned more than 18,000. This implies that lower quartile Q1 =18,000
Absolute Measure of Dispersion = Q3 – Q1 = 45,000 – 18,000 = 27,000
Relative Measure of Dispersion
Co-efficient of Quartile Deviation
Statistics for Economics Class 11 NCERT Solutions Chapter 6 Measures of Dispersion Q4

Question 5.
The yield of wheat and rice per acre for 10 districts of a state is as under
Statistics for Economics Class 11 NCERT Solutions Chapter 6 Measures of Dispersion Q5
Calculate for each crop,
(i) Range
(ii) QD
(iii) Mean’Deviation about Mean
(iv) Mean Deviation about Median
(v) Standard Deviation
(vi) Which crop has greater variation?
(vii) Compare the value of different measures for each crop.
Answer:
(i) Range
(a) Wheat Highest value of distribution (H) = 25
Lowest value of distribution (L) = 9
Range = H – L = 25 – 9 = 16
(b) Rice Highest value of distribution (H) = 34
Lowest value of distribution (L)=12
Range = H – L = 34 – 12 = 22
(ii) Quartile Deviation
(a) Wheat Arranging the production of wheat in increasing order 9, 10, 10, 12, 15, 16, 18, 19, 21, 25
Q1 = N+14th item = 10+14th item = 114th item
= 2.75th item
= Size of 2nd item + 0.75 (size of 3rd item – size of 2nd item)
= 10 + 0.75(10 – 10)
= 10 + 0.75 × 0
= 10
Q3 = 3(N+1)4th item = 3(10+1)4th item
334th item = 8.25th
= Size of 8th item + 0.25 (size of 9th item – size of 8th item)
= 19 + 0.25(21 – 19)
= 19 + 0.25 × 2
= 19 + 0.50 = 19.50
Quartile Deviation = Q3Q12=19.50102=9.502 = 4.75
(b) Rice Arranging the data of production of rice
12, 12, 12, 15, 18, 18, 22, 23, 29, 34 item
Q1 = N+14th item = 10+14th item
= 2.75 th item
= Size of 2nd item + 0.75 (size of 3rd item – size of 2nd item)
= 12 + 0.75(12 – 12) = 12 + 0.75 × 0
= 12
Statistics for Economics Class 11 NCERT Solutions Chapter 6 Measures of Dispersion Q5.1
= 8.25th item
= Size of 8th item + 0.25 (size of 9th item – size of 8th item)
= 23 + 0.25(29 – 23)
= 23 + 0.25 × 6
= 23 + 1.5
= 24.5
Quartile Deviation = Q3Q12=24.5122=12.502 = 6.25

(iii) Mean Deviation about Mean
(a) Wheat
Statistics for Economics Class 11 NCERT Solutions Chapter 6 Measures of Dispersion Q5.2

Statistics for Economics Class 11 NCERT Solutions Chapter 6 Measures of Dispersion Q5.3

(b) Rice
Statistics for Economics Class 11 NCERT Solutions Chapter 6 Measures of Dispersion Q5.4

(iv) Mean Deviation about Median
(a) Wheat
Statistics for Economics Class 11 NCERT Solutions Chapter 6 Measures of Dispersion Q5.5

Statistics for Economics Class 11 NCERT Solutions Chapter 6 Measures of Dispersion Q5.6

(b) Rice
Statistics for Economics Class 11 NCERT Solutions Chapter 6 Measures of Dispersion Q5.7

Statistics for Economics Class 11 NCERT Solutions Chapter 6 Measures of Dispersion Q5.8

(v) Standard Deviation
(a) Wheat
Statistics for Economics Class 11 NCERT Solutions Chapter 6 Measures of Dispersion Q5.9

(b) Rice
Statistics for Economics Class 11 NCERT Solutions Chapter 6 Measures of Dispersion Q5.10

Statistics for Economics Class 11 NCERT Solutions Chapter 6 Measures of Dispersion Q5.11

(vi) Coefficient of Variation
(a) Wheat
CV =σX¯¯¯¯¯×100=5.0415.5×100 = 32.51
(b) Rice
CV =σX×100=7.1619.5×100 = 36.71
Rice crop has greater variation as the coefficient of variation is higher for rice as compared to that of wheat.
(vii) Rice crop has higher Range, Quartile Deviation, Mean Deviation about Mean, Mean Deviation about Median, Standard Deviation and Coefficient of Variation.

Question 6.
In the previous question, calculate the relative measures of variation and indicate the value which , in your opinion, is more reliable.
Answer:
(i) Coefficient of Range
(a) Wheat
Statistics for Economics Class 11 NCERT Solutions Chapter 6 Measures of Dispersion Q6

Statistics for Economics Class 11 NCERT Solutions Chapter 6 Measures of Dispersion Q6.1
The coefficient of variation is more reliable than all other measures.

Question 7.
A batsman is to be selected for a cricket team. The choice is between X and Y on the basis of their scores in five previous scores which are
Statistics for Economics Class 11 NCERT Solutions Chapter 6 Measures of Dispersion Q7
Which batsman should be selected if we want,
(i) a higher run-getter, or
(ii) a more reliable batsman in the team?
Answer:
Batsman X
Statistics for Economics Class 11 NCERT Solutions Chapter 6 Measures of Dispersion Q7.1

Statistics for Economics Class 11 NCERT Solutions Chapter 6 Measures of Dispersion Q7.2
(i) Average of Batsman X is higher than that of Batsman Y, so he should be selected if we want a high scorer.
(ii) The Batsman Y is more reliable than Batsman X. This is because the coefficient of variation of Batsman X is higher than that of Batsman Y.

Question 8.
To check the quality of two brands of light bulbs, their life in burning hours was estimated as under for 100 bulbs of each brand.
Statistics for Economics Class 11 NCERT Solutions Chapter 6 Measures of Dispersion Q8
(i) Which brand gives higher life?
(ii) Which brand is more dependable?
Answer:
For Brand A
Statistics for Economics Class 11 NCERT Solutions Chapter 6 Measures of Dispersion Q8.1
For Brand B
Statistics for Economics Class 11 NCERT Solutions Chapter 6 Measures of Dispersion Q8.2

Statistics for Economics Class 11 NCERT Solutions Chapter 6 Measures of Dispersion Q8.3
(i) The average life of bulb of Brand B is comparatively higher than that of Brand A.
(ii) The bulbs of Brand B are more dependable as CV of Brand B is lesser than CV of Brand A.

Question 9.
Average daily wage of 50 workers of a factory was ₹ 200 with a Standard Deviation of ₹ 40. Each worker is given a raise of ₹ 20. What is the new average daily wage and standard deviation? Have wages become more or less uniform?
Answer:
N = 50
x¯¯¯ = 200
σ = 40
Average wage =  Total wages  Number of workers 
200 =  Total wages 50
So, total wages = 200 × 50 = ₹ 10,000
Now, increase in wage rate = ₹20
Total raise = 50 × 20= ₹ 1,000
Total wage after raise = ₹ 10,000 + 1,000 = ₹ 11,000
New average wage =  New total wages  Number of workers =11,00050 = ₹220
Thus, Mean increases by the amount of increase in wage of each worker as the absolute increase was equal for all.
Standard Deviation will remain the same that is ₹40 as Standard Deviation is independent of origin and hence addition of equal amount in all the values will not cause any change in the Standard Deviation.
Uniformity of wages can be seen by coefficient of variation.
Previously, the coefficient of variation was
CV = σX¯¯¯¯¯×100 = (40/200) × 100 = 20
The new coefficient of variation after wage increase is given by
CV = σx×100 = (40/220) × 100 = 18.18
This shows that wages have become more uniform now as the new CV is lower.

Question 10.
If in the previous question, each worker is given a hike of 10% in wages, how are the Mean and Standard Deviation values affected?
Answer:
Average wage = ₹ 200
Hike in wages = 10%
Since arithmetic mean is not independent of scale, the mean will also increase by 10%.
10100×200 = ₹ 20
Hence, the new Mean will be
200 + 20 = ₹ 220
Standard Deviation is also not independent of scale, hence, the Standard Deviation will also increase by 10% Initial Standard Deviation = ₹ 40
So, New Standard Deviation = ₹40 +10% of 40
= ₹ (40 + 4)
= ₹ 44

Question 11.
Calculate the Mean Deviation using Mean and Standard Deviation for the following distribution.
Statistics for Economics Class 11 NCERT Solutions Chapter 6 Measures of Dispersion Q11
Answer:
Statistics for Economics Class 11 NCERT Solutions Chapter 6 Measures of Dispersion Q11.1

Question 12.
The sum of 10 values is 100 and the sum of their squares is 1090. Find out the coefficient of variation.
Answer:
Statistics for Economics Class 11 NCERT Solutions Chapter 6 Measures of Dispersion Q12